

The Dashboard also functions as a shortcut to the Reports where you can find Donations by Month, Top Donors, Slipping Givers, New Givers, Giving Statements as well as Exports.
Clicking each section in the Dashboard immediately brings you to a specific page where you can see high level giving trends and information.
Time Periods
Clicking the date range drop-down box below the graph shows you varied time periods to choose from.


Total Donors
Gives an overview of the total number of donors chosen for the time period. Clicking on this brings you to the ‘Contacts’ tab
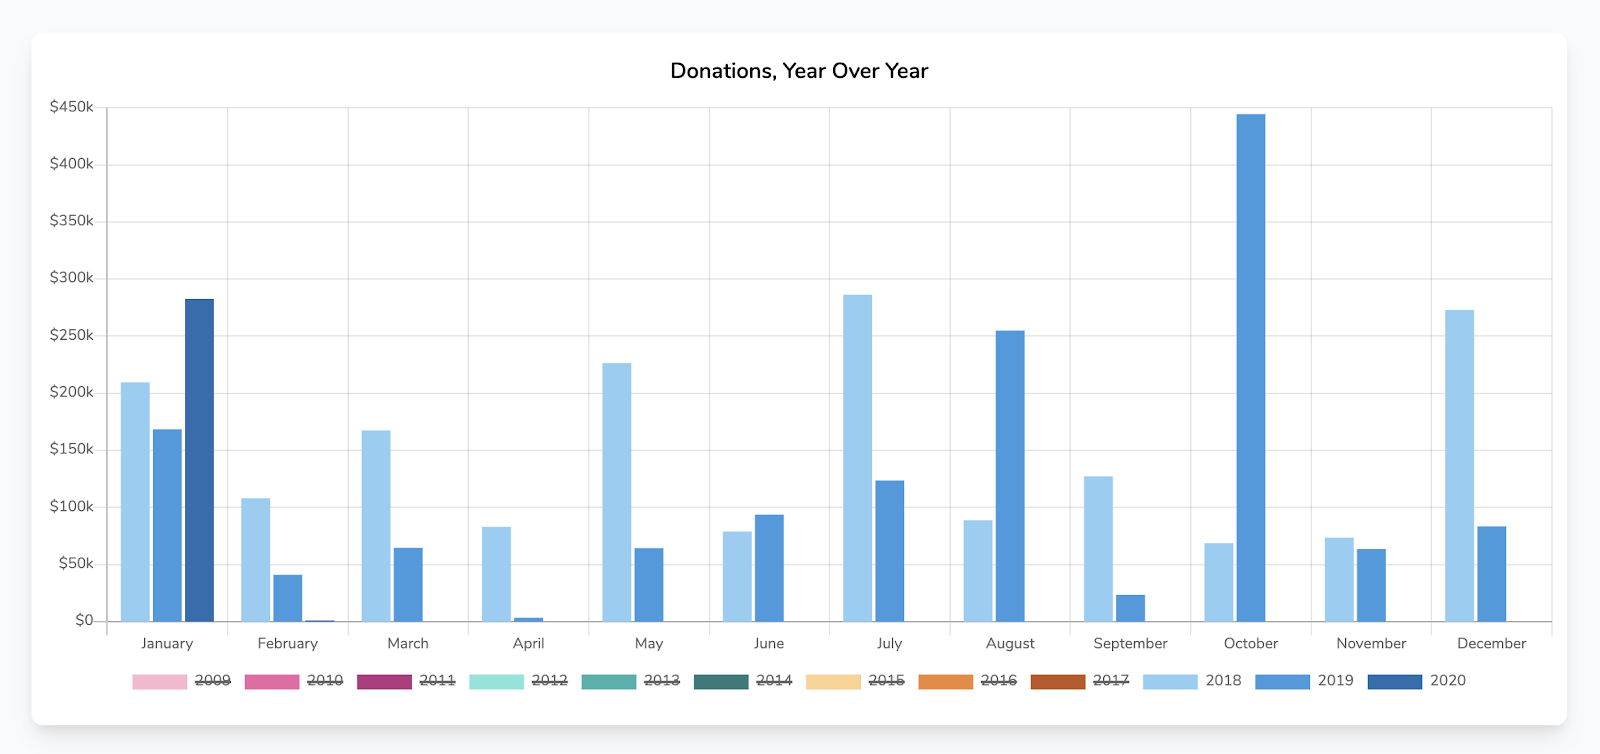
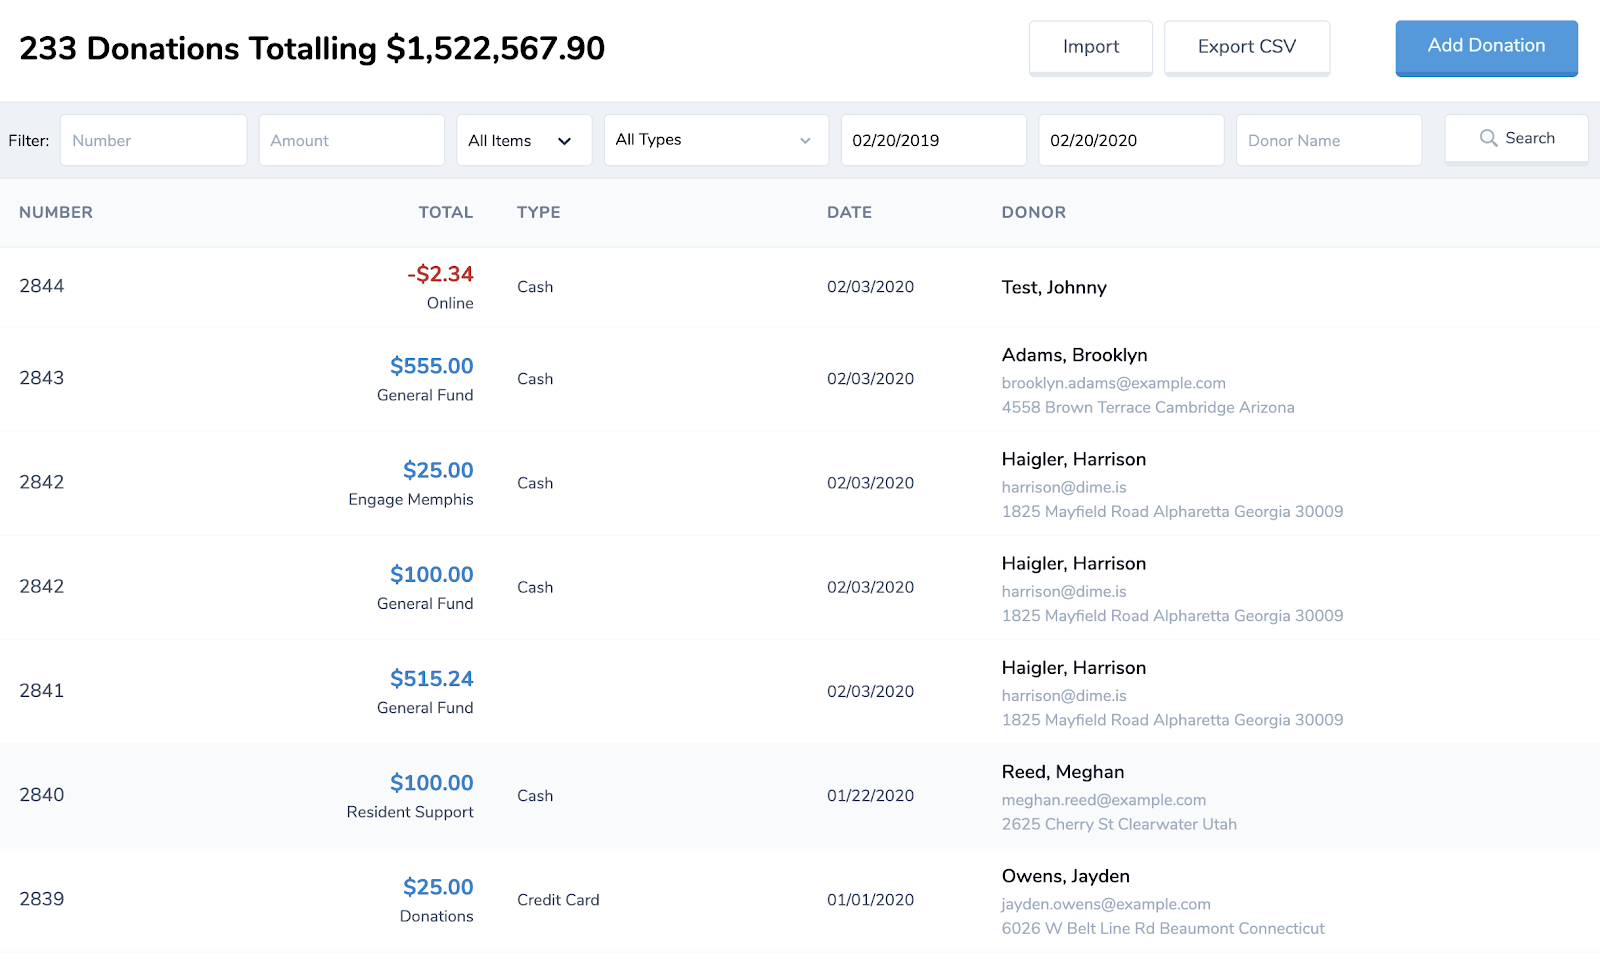
Total Donations
Shows the total amount for the chosen time period. Clicking on this tab shows a detailed view of each donation that makes up the total.
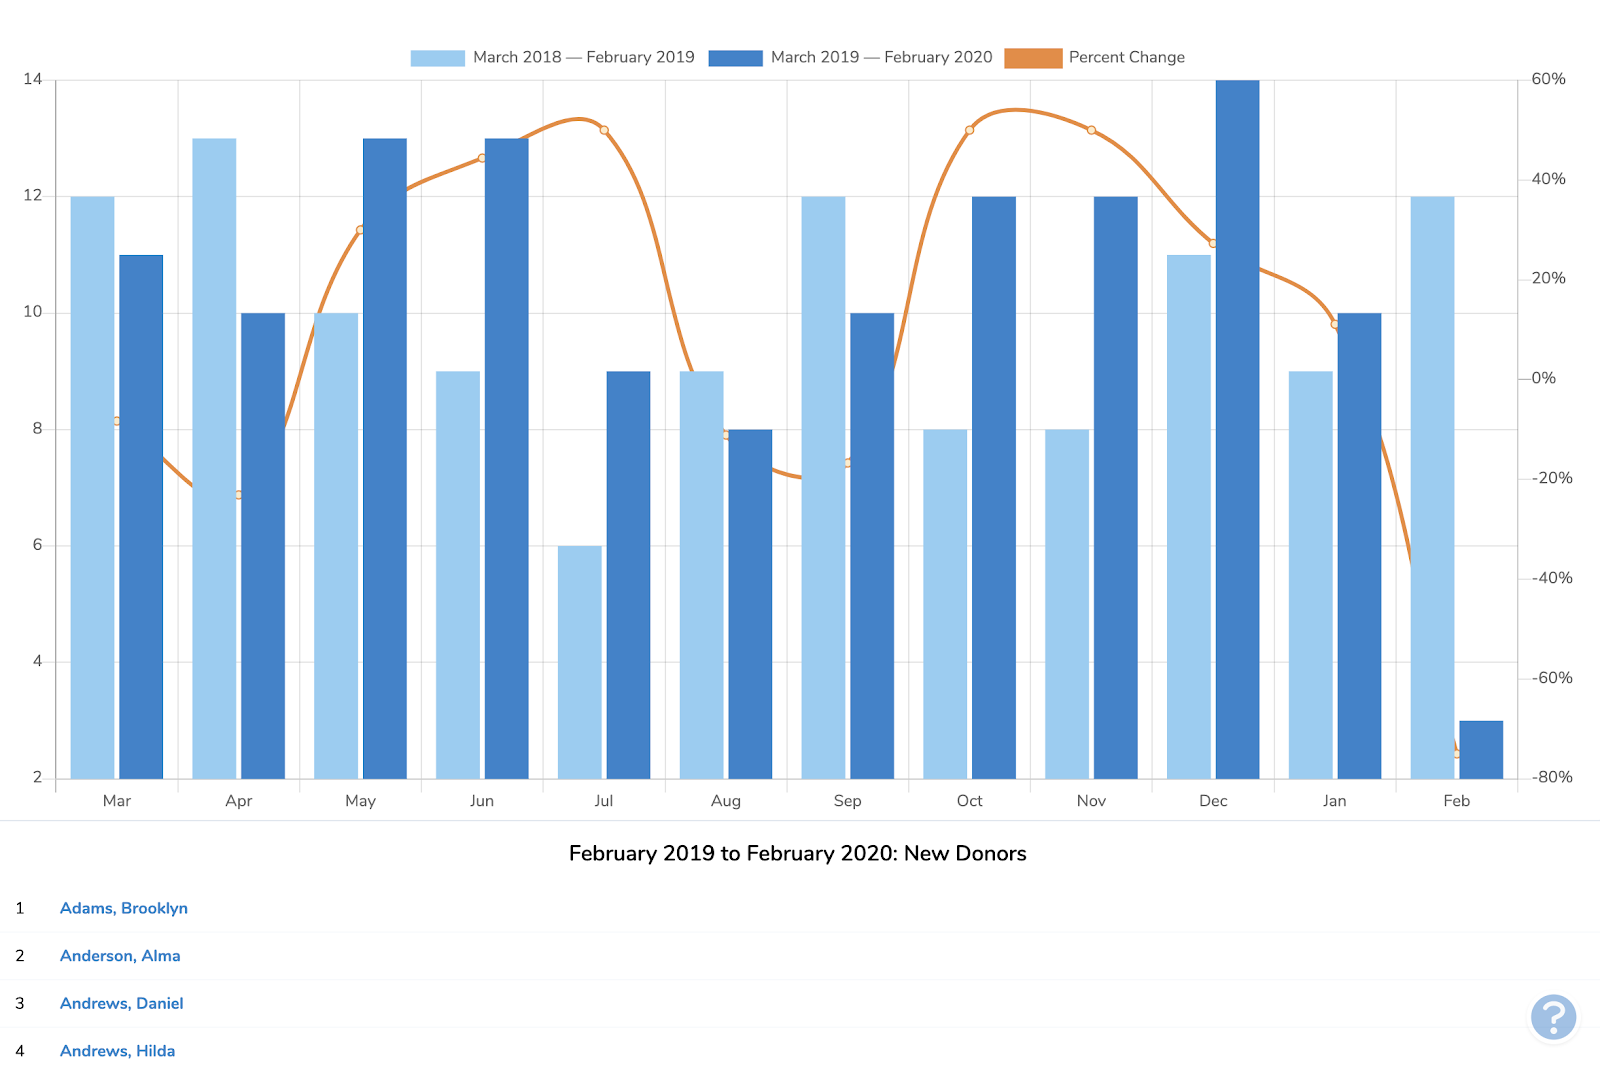
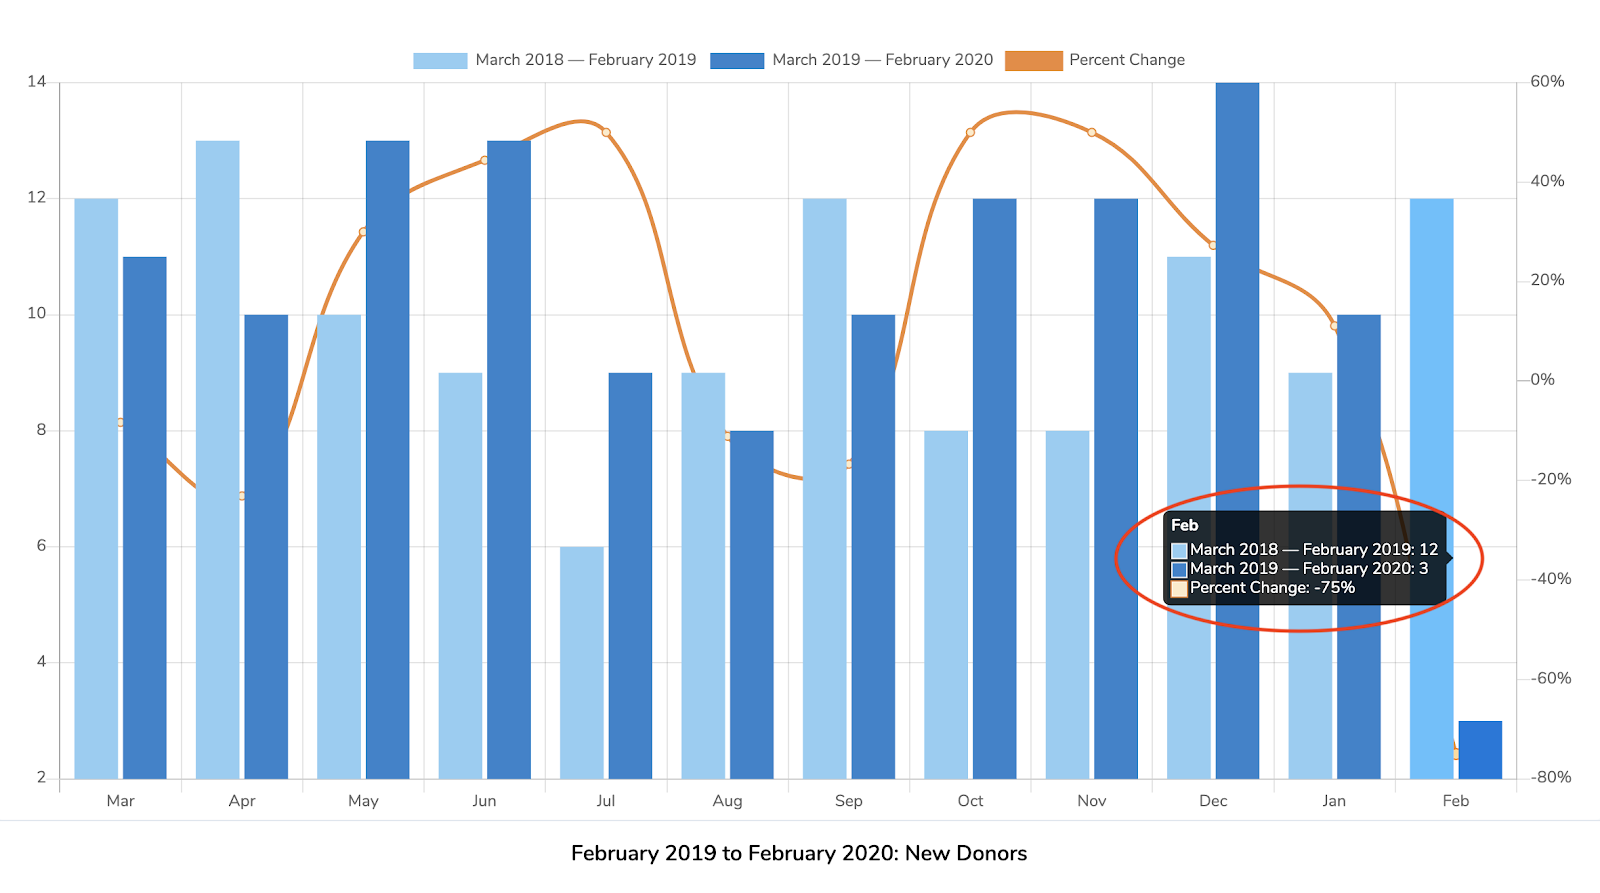
Shows the total number of new donations for the specific time period. Clicking brings you the details of each new donation under the chosen time period and a graph showing the trend.
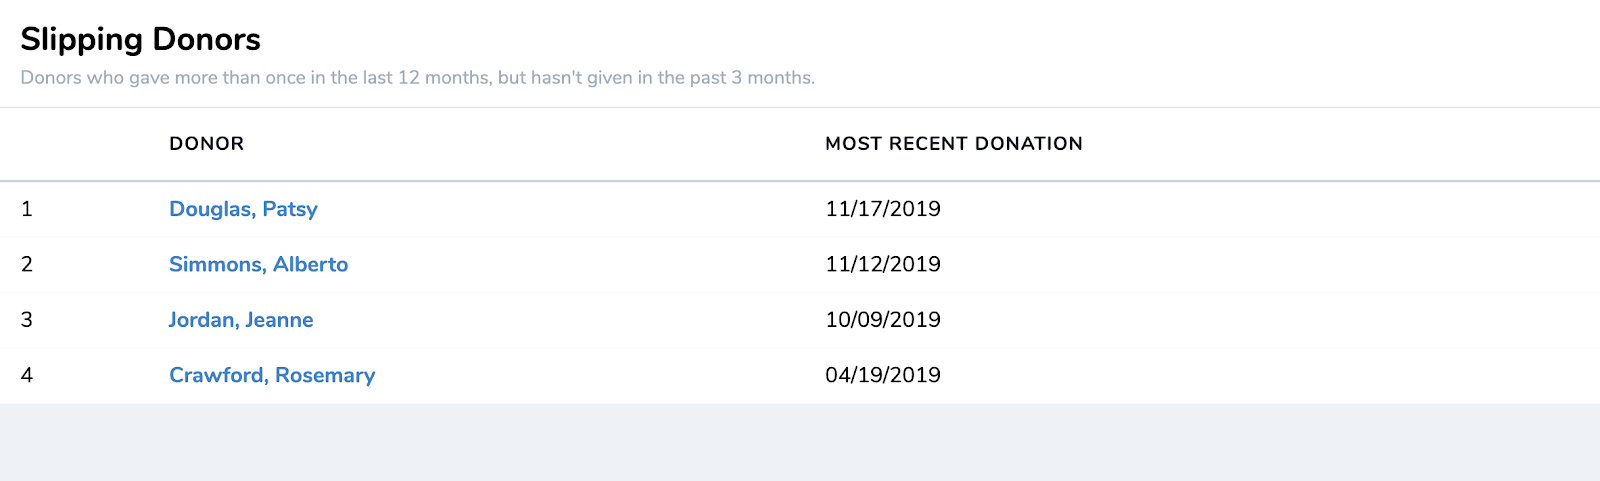
Slipping Givers
Shows donors who gave more than once in the last 12 months, but have not given in the past three months.
Donations by Band
Provides an overview of the top donors by band, arranged by range: over $100k, $50k to $100k and others, as seen below.


